Is fiat currency about to collapse?
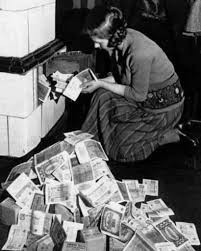
The Changing World Order
“In order to maintain or increase their wealth, they [the rich] work with the people who have the political power, who are in a symbiotic relationship with them, to set and enforce the rules. I saw how this happened similarly across countries and across time.”
Ray Dalio, Chapter 1 | The Big Cycle in a Tiny Nutshell
I spent some time looking at the investment situation in general and at gold prices in particular and thought that it would be useful to share some findings.
The alternative investment media features many who make panic-inducing claims with high levels of certainty. Oftentimes they are selling Wall Street Secret Sauce™. I prefer to listen to those who have survived and prospered in the investment business over decades of market turbulence, including Ray Dalio, Warren Buffet and others. Tellingly, their statements are much less definitive and focus on identifying big trends rather than daily noise.
I don’t have any Secret Sauce™ to sell and the best I can offer is a summary of analysis from those who really do have the knowledge and research capacity. In particular, Ray Dalio whose “Principles for Dealing with The Changing World Order” provides clues as to where we are in the mega-cycle, what conditions we may see in the U.S. and other developed economies, and what we should prepare for. I would recommend buying the book, Dalio has also generously posted the charts in the book for free and posted a number of articles on economicprinciples.org
Dalio’s book focuses on the economic life cycles of empires and analyses the transition from the Dutch to the British empire, from the British to the American empire and strongly hints at a transition to a Chinese empire. One of the most impressive parts of the book is that it draws on Dalio’s access to a very long time series (going back to the 1800s) across multiple countries.
He creates and interesting illustration of the lifecycle of the typical empire. In terms of the chart below, the United States (and several other developed market economies) are somewhere around circle 14 at the “printing money” stage.
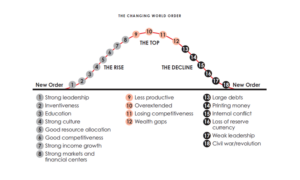
Interestingly, Dalio’s analysis aligns very closely with “The Fate of Empires”, Sir John Glubb’s brilliant 1976 essay that illustrates a 250-year lifecycle compared to Dalio’s “200 to 300 years”. While Glubb’s paper focuses on a completely different driver, primarily the loss of religious faith, he describes many of the same effects.
The Debt Cycle
You may remember that the 2008 Global Financial Crisis (GFC) was attributed primarily to excess borrowings (leverage) in the U.S. household sector, particularly in the sub-prime mortgage subsector. What is probably not well understood is that leverage in 2025, expressed both in terms of US dollars and as a percentage of GDP, is much much higher than it was in 2008.
Domestic nonfinancial leverage (Government, Households plus Business) at the end of 2025 (USD 80.7 trillion) was a whopping USD 47 trillion higher than at the end of 2007, of which USD 27.8 trillion was added by the Federal Government alone.
Whilst at least some media attention is focused on the level of Federal Government debt (107.8% of GDP), they rarely cover the consolidated level of debt across all sectors (256% of GDP). The level has come down fractionally from its 2020 COVID peak, but it is still almost double the debt level of 1980. The reduction in debt levels of the household sector expressed as a percentage of GDP post 2008 (green) have been more than offset by the Federal Government spending money like a drunken sailor (Dark blue).
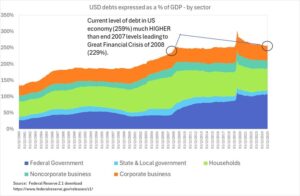
Even this picture though is still not complete as the Federal Reserve Z1. data does not include enormous off the balance sheet liabilities the U.S. Government has to fund in the form of Social Security, Medicare and other entitlement programmes. The present value of those liabilities (the excess of programme expenditure over programme revenue) adds another cool USD 88.4 trillion on to U.S. Government liabilities, equivalent to around 287% of GDP.
In an ideal world debt levels don’t matter because they are channelled into productive activities and debt and GDP move roughly in tandem. In the real world, problems start when debt is used to fund paper assets or to fund consumption, neither of which creates any durable increase in productive activity (measured by GDP). It is pretty obvious that the U.S. (and other major economies) are quite deep into this position now (the short talk by Professor Werner helps explain the difference between productive debt and unproductive debt).
The chart below zooms out and looks at a long time period from 1900 to 2021 and illustrates the significant expansion of non-financial debt in the “Roaring 20s” in the U.S. and what this meant for subsequent interest rates and money printing.
The chart illustrates that in 2008 the level of private sector non-financial debt exceeded the level achieved in the “Roaring 20s” (it currently stands at 137% of GDP by my calculations). In both 1920s and in 2008, the government’s response was to drop interest rates to zero and start printing money (expressed as monetary base to GDP).
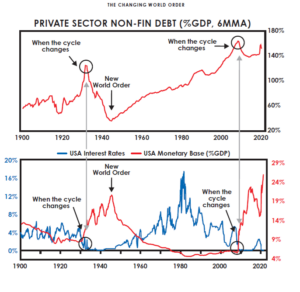
In Dalio’s analysis, the government’s policy responses are additive, so when the impact of zero interest rate policies produce diminishing returns, they then move to excessive money printing. In the final stage, this money printing is tied with massive government spending (think forever wars), which creates large deficits – anything to keep the party going!
Money printing creates winners and losers, the winners are the people who hold financial assets (the wealthy) and the losers are the people on fixed wages who see their real incomes fall as consumer prices increase. This is a subject that I covered in the post “Where did the money go?” which explained the Cantillon Effect.
Over time the nominal value of GDP grows due to high levels of inflation whilst the debt mountain stays fixed in nominal US Dollars (with the exception of Treasury Inflation Protected Securities) and the relationship between debt and GDP eventually recovers without the need to explicitly restructure excess debt.
An interesting Substack author drew the waterfall below which highlights that when new bank money is pumped into the economy, it benefits those closest to the money spigots (ie. the owners of financial assets) whilst penalising the general workforce.
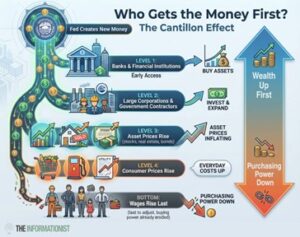
Insiders understand that large amounts of leverage in the economy are untenable at some point in time and that money printing will lead to inflation, but by positioning themselves they can maintain and even expand their wealth no matter what the conditions are. Unfortunately, the average Joe is working for a nominal salary and has limited time and ability to stay ahead of the curve.
What comes next
In political terms, the increase in wealth inequalities from money printing create further internal friction within society. This manifests itself in extreme “left” and “right” populist positions, irreconcilable arguments, polarisation and even open conflict (circle number 18). These internal fights within a nation state tend to coincide with external conflicts as a geopolitical peer seeks to take the top spot in the global pecking order. This is the case with China’s gradual move towards top-dog status.
In financial terms, the currency eventually falls in value because of the increase in the amount of money in the economy. At the moment we have “inflation” of financial asset prices with lower inflation of the prices of goods and services, but this will likely move into high levels of inflation more generally. In high inflation environments (particularly those which involve violent political disputes), the population will be primed to accept the severe pain that is required to stop inflation. Typically, this means moving to a currency system that is somehow linked to something tangible, or otherwise to figure out a way to recover confidence in the currency by credibly limiting its supply.
Gold and shares
I bought a lot of paper gold in September 2020 and recently sold some down following a very strong rally. It was inevitable that there would be some profit-taking after the strongest gold rally since 1979.
If you look at gold as a store of value and as insurance against the devaluation of the dollar (through money printing), it is interesting to compare the price of gold per ounce to the amount of money circulating in the U.S. (as measured by M2 which is essentially cash and short term bank deposits). Of course, there are many factors underlying the gold price, however one main assumption is that the price of gold (largely fixed supply) should go up as fiat money is created. Looking at the chart below, it seemed reasonably obvious that the gold price got well ahead of where it should be based solely on M2 considerations – although I’m not complaining!
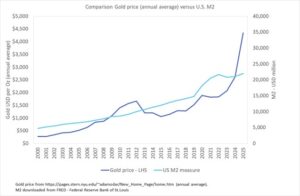
The gold price is taken from Damodaran Online, which uses nma.org average prices for the year (2025 = USD 4,339 per oz). Calculating a ratio of M2/Gold price showed that gold was becoming expensive on a historic basis.
Shares
Given Ray Dalio’s analysis that we are in the late stage of a big debt cycle (circle 14), it makes sense to be nervous about the US Dollar, however it doesn’t make sense to avoid investing altogether. The temptation to sit on the sidelines and avoid possible downward corrections carries enormous opportunity costs as I know from personal experience. The alternative is to “buy and hold”, remaining invested over the long term which will work provided you don’t buy into bubbles like 2000, 2007 and now.
I worry that extreme fear created by some in the dissident space pushing the Great Taking narrative will prevent people participating in any equity returns. If you choose to opt out of ways of trying to maintain the value of money in a high inflation environment you will likely end up broke.
In another note, I plan to look at the issue of what to invest in, how to position for a possible acceleration of inflation in an environment where some equities are at or above 2000 bubble valuation levels. In the meantime, I wanted to leave a very useful summary of geometrical average returns posted by Professor Aswath Damodaran from Stern Business School. You can download the entire data set and look at the returns and investigate links between stock, bonds, inflation, gold and real estate (I added in the inflation figures below).
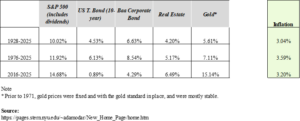
These returns may not look particularly large, but when you start compounding at rates like 10%, you end up with very large numbers. Warren Buffet’s Berkshire Hathaway has excelled at buying and holding a core equity portfolio over decades, whilst selling high and buying low for more peripheral assets. Berkshire achieved a respectable return of over 6 million percent between 1964 and 2025, equivalent to 19.7% compounded annually. As explained above, these returns were generated when debt levels were lower and, in the current late stage of a large debt cycle returns going forward will likely be different to those in the past. Here Buffet describes corporate America’s ability to grow earnings and pay dividends:
“In aggregate, American business has done wonderfully over time and will continue to do so (though, most assuredly, in unpredictable fits and starts). … The goal of the non-professional should not be to pick winners … but should rather be to own a cross-section of businesses that in aggregate are bound to do well. A low-cost S&P 500 index fund will achieve this goal.”
2013 Berkshire Hathaway Shareholder Letter
Conclusion
The illustrative lifecycle model produced by Ray Dalio is based on analysis of the rise and fall of many countries over history. The empire lifecycle that he arrived at for “200 to 300 years” ties in exactly with the typical two hundred and fifty year lifecycle proposed by Sir John Glubb. Dalio suggests that excess leverage, zero interest rates, mass money printing and large deficits are baked into the system rather than being the product of nefarious conspiracies. Money printing is simply the path of least resistance in order to restructure debt by stealth by inflating up GDP whilst keeping nominal debt levels suppressed. This process creates winners (wealthy owners of financial assets) and losers (regular workers who see a fall in their real wages). If you want a “Great Taking” theory, then mass money printing fits the bill without the need for a new conspiracy (in fact insiders need the public to be in financial markets to act as an exit so the “Great Taking” narrative makes no sense to me). Dalio also confirms the “conspiracy theory” that politicians work hand-in-glove with wealthy elites in a “symbiotic relationship”.
Money printing finally breaks down under runaway inflation and, following a period of suffering, people are then willing to endure the hardship to re-establish sound money.
I’ll be looking more at ways to adjust my own investments and will be sharing those thoughts (for what they are worth) with paid subscribers in the near future. The single most important lesson that I learned from the post is that although equity markets are subject to sharp downward corrections, the overall positive trend in corporate earnings and valuations is unbeatable over a medium time horizon so long you avoid investing into bubble conditions like 2000, 2007 and now. Completely opting out of owning diversified equity indices will likely carry tremendous opportunity cost.
Please let me have your thoughts and level of interest in expanding on the topic of fiat collapse, gold, equity investments and/or Bitcoin.
Best wishes
Alex

Alex Williams is by training a physicist and was one of the first people to highlight the flawed nature of the Imperial COVID model. He spent his career in consultancy and fund management including a long stint in Russia. His last job was in one of the world’s largest pension funds where he handled corporate governance issues and shareholder voting over a portfolio of 2,300 equity investments.
Disclaimer
This website is operated by Berkshire Williams. We are not registered with the Financial Conduct Authority (FCA) and are not authorised by the FCA to provide financial advice, investment recommendations, or any regulated activities relating to pensions or investments. The information and content on this website are provided for general information and educational purposes only. They do not constitute personal recommendations, financial, investment, pension, or tax advice. Nothing on this site should be relied upon as such. You should always obtain independent professional advice from an FCA-authorised adviser before making any financial or investment decisions. The suitability of any investment or pension option will depend on your individual circumstances. Berkshire Williams accepts no responsibility or liability for any loss or damage arising from any reliance placed on the content of this website