Space X – the new South Sea Company

What SpaceX’s valuation tells us about bear markets
With SpaceX listing this week with an eye-watering valuation of USD 2.1 TRILLION, equal to a whopping 112x revenue, I thought it would be good to remind ourselves about what a bear market looks like.
I could give a trite answer to the crash question and say definitely yes, bull markets pretty well always end with a bear market correction, defined as a fall of 20% or more from a peak. Of course the million dollar question is when will this happen? And here I have to fudge and anyone that confidently claims that they can predict when this will happen is being dishonest. The best anyone can do is set out the evidence and make an educated guess.
Global stock market valuations are generally high and this is a function of the fact that global stock market indices are driven by the US market, which is itself driven by a handful of stocks called the Magnificent 7. When markets are very high many people seek to rationalise this over-valuation with the classic “this time its different” argument. These arguments are based on the idea that the new technology which often drives market excesses will deliver productivity gains that have never before been seen in history. That’s a very tall order when history has included productivity gains from stunning innovations like railways and electrification. Mathematical formulae can also be invoked so that high rates of earnings growth coupled with low interest rates can be extrapolated forever in order to “prove” stratospheric valuations. In fact at the margin where growth rates start to exceed discount rates equations can generate nonsensical answers.
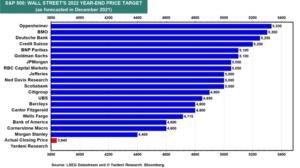
The investment community can apparently predict that one day in the far distant future SpaceX’s earnings will be so high that discounting them to today justifies a valuation of USD 2.1 trillion. This involves predicting earnings for businesses that are not even close to existing, including huge datacentres floating around in space. Remember dear reader that these are the same analysts who can’t estimate where a stock market index will be in twelve months’ time with any degree of accuracy, see below comparison of forecast 2022 year end S&P 500 (blue) made in December 2021 versus actual outcome (red).
Being a value investor is much more about a frame of mind than having any superior analytical or mathematical skill and is based on a belief that there is an intrinsic value for a company (and therefore for a share). Quoted share prices can and do depart very significantly from those intrinsic values. In Benjamin Graham’s classic 1949 book on value investing he highlights the case of a fairly boring retail business called S.H. Kress whose earnings per share barely moved over decades (1923 to 1945) but whose share price nonetheless wandered all over the place (USD 4.10 to USD 0.6 approximately). Warren Buffet famously provided an allegory of the stock market being an eccentric farmer living next door who shouts farm prices at you every day, most times you should ignore him, but in a case where he shouts a particularly high price you sell to him and if he shouts a low price you buy from him.
Human nature being what it is though, many of us often join in market euphoria and succumb to market pessimism since the market is nothing more that the aggregate behaviour of its participants. For those people who do opt out of crowd behaviour they will routinely be insulted as dunces who don’t have the imagination necessary to understand why the current bubble actually represents a justifiable market high. Even now, the management of Berkshire Hathaway are being pilloried for moving into a high cash weighting and missing much of the action.
How can you tell if the market is overvalued?
Unfortunately, private investors’ ability to access reliable valuation data at the market level was reduced when Standard & Poors stopped publishing some extraordinarily useful data on S&P 500 earnings per share. This leaves Professor Shiller’s data on the Cyclically Adjusted Price Earnings (CAPE) ratio as one of the few free and reliable resources available to gauge market valuation. The chart below is derived from his data with periods of market corrections (defined as 20% of more drops in the S&P 500) show as shaded grey areas.
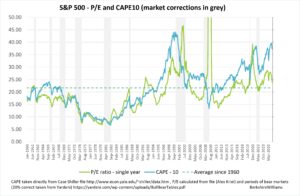
The chart runs from 1960 and shows that the CAPE is far above its long-term average (dotted line) and approaching 2000 levels, which itself is well above the CAPE level reached in the 1929 high. The measure gives a good idea of where we are in terms of valuations (very high), but doesn’t give a “magic number” to determine when a decline is likely. The grey shared areas represent S&P 500 bear markets and you can see a wide range of CAPE values heading into bear markets.
Professor Shiller combines the CAPE with real bond yields to generate another indicator called the Excess CAPE yield (briefly the earnings yield (e/p) less real bond yields). The Excess CAPE was for a long time a good indicator of subsequent S&P 500 returns. So if you buy high (when the orange line is low) your returns from that point going forward for ten years (blue dotted line) will be low or negative as the stock market goes sideways or even downwards. For the US market anyone buying into the July 1929 high would have to wait a whopping 25 years until 1954 to see that level again (although they would have collected significant dividends during the period). It takes quite a while to get the hang of what these indicators show, but the bottom line is that if you buy high your subsequent returns are low or negative.
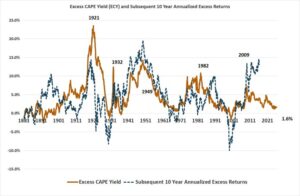
The Excess Cape indicator stopped working well around 2016 when you had high equity prices, but still achieved stellar returns for the subsequent ten year period ending April 2026. A lot of commentators claimed that the indicator was broken, but in reality the enormous continuous money printing since 2008 has probably created the conditions for the S&P to rally despite the high valuations from 2016 onwards. I suspect central bank money printing derailed the predictive value of the Excess CAPE indicator. Interestingly the rally from April 2016 to April 2026 is expressed in nominal Dollars, if you start looking at the S&P 500 rally in terms of gold then it is down by 24% since 2017 when expressed in ounces of gold.
What do bear markets look like?
The overall pattern of the S&P 500 is long bull market rallies followed by shorter, sharper and smaller bear market corrections. On balance that pattern leads to a long term upward movement and generates the 10% plus annualised rates of return identified by Professor Damodaran between 1928 to 2025 on the S&P 500 with dividends reinvested. That statistic won’t offer a lot of solace to someone buying in the October 2007 peak and seeing a 56.8% capital loss.
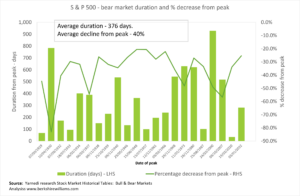
Bull markets between 1928 and 2022 identified by Yardeni Research have had an average duration of 5.2 years with an average trough to peak growth of 177%. By contrast the average bear market has had a duration of 376 days with an average decline form peak to trough of 40%. The outstanding bear market was between April 1930 to June 1932 where the stock market lost 83%.
What is going to happen next?
I can say with absolute certainly that the current S&P 500 stock market will certainly be followed by a nasty downward correction. Based on historic experience that correction would be around 40% from a peak. The bottom of bear markets represent tremendous opportunities for those who have cash and the discipline to enter a market which others are fleeing.
“Be fearful when others are greedy and greedy when others are fearful.”
Berkshire Hathaway 1986 shareholder letter
Nobody can tell you when that will happen with any certainty as not only are markets somewhat irrational, but the appearance of central bank money printing means that any forecasts are liable to be wrong. Central bank money printing can create bubbles and prevent crashes in nominal terms, but the damage will be done in the longer term through the debasement of the currency itself.
My own feeling is that the breaks in a rally in 2020 and 2022 were somewhat artificial and caused by governments response to “COVID”. In reality, it can be claimed that the S&P 500 has been in more or less a continuous rally since March 2008 and a major correction is well overdue. This long rally corresponds to the start of large scale money printing which has been more or less continuous from 2008 to 2022. A lot of important equities like Oracle, Netflix, Salesforce have rolled over and companies like Meta are coming under pressure (disclosure I own put options on Meta).
Investing is always challenging and the current environment includes a number of additional uncertainties. Staying out of the market for long periods of time carries opportunity costs of its own, but the more overvalued a market gets the more it makes sense to move into cash and this is exactly what Berkshire Hathaway has been doing. The only rational way to interpret this move is to assume that they have created a war chest to deploy in the event of a major downward market correction.
What about the UK
I have focused on the US because it is the largest stock market in the world accounting for over 70% of the MSCI World index. When problems start in the US it is likely that stock market correlations between countries will all move upwards towards one and many other markets will correct in lockstep. I have previously discussed the actions of central banks in the U.S., Europe and the UK are also all highly coordinated, so what happens in the US will have a large knock-on effect.
So whilst large sections even of the US market and the UK and other European markets are not expensive, they will almost certainly become even less expensive in the event of a U.S. correction.
What should I do?
Many people have “left it to the experts” and transferred their financial asset to an asset management company. Whilst there are a tiny handful of good asset managers, unfortunately the bulk of mainstream asset management operations in the UK are diabolical. They extract high fees from their clients which are almost never offset by improved performance. In a study of U.S. funds, Standard & Poors identified that a full 89% of funds analysed underperform the S&P 500 benchmark over a 5 year period.
Many UK asset managers also sell “multi-asset” or “low volatility” fund-of-fund products that drastically reduce returns by mixing in low or negative return government bonds into savings. The rates of return are diluted down to low single digits and in some cases are lower than inflation.
In all of the cases that I have looked at savers would be far better off, extracting themselves from expensive mainstream asset management and owning low-cost indices via their own online brokerage accounts.
The only real proviso (as noted above) is to avoid investing heavily into a market peak. Working together with clients we can often double rates of return without taking on pointless risks.
If you are interested in discussing this in more detail, please contact alex@berkshirewilliams.com or joanna@berkshirewilliams.com
Best wishes
Alex

Alex Williams is by training a physicist and was one of the first people to highlight the flawed nature of the Imperial COVID model. He spent his career in consultancy and fund management including a long stint in Russia. His last job was in one of the world’s largest pension funds where he handled corporate governance issues and shareholder voting over a portfolio of 2,300 equity investments.
Disclaimer
This website is operated by Berkshire Williams. We are not registered with the Financial Conduct Authority (FCA) and are not authorised by the FCA to provide financial advice, investment recommendations, or any regulated activities relating to pensions or investments. The information and content on this website are provided for general information and educational purposes only. They do not constitute personal recommendations, financial, investment, pension, or tax advice. Nothing on this site should be relied upon as such. You should always obtain independent professional advice from an FCA-authorised adviser before making any financial or investment decisions. The suitability of any investment or pension option will depend on your individual circumstances. Berkshire Williams accepts no responsibility or liability for any loss or damage arising from any reliance placed on the content of this website